Friday, April 18, 2014


Monday, March 31, 2014

Thursday, March 20, 2014
Graphing Exponential Growth/Decay
Graphing Exponential Growth/Decay
1. Create the Parent Graph.
2. Identify A,H,K.
3. Create your new T-Chart.
Domain: All real #'s.
Range: y>k; when a is positive. y<k; when a is negative.
Asymptote: y=k.
4. Draw Asymptote.
5. Graph new points.
Exponential Formula: y=a×bx-h+k
a = multiplier.
a>1 = stretch
0<a<1 = compression
a< 0(negative) = flipped over x-axis.
b = base
b>1 = whole #, growth, always increasing.
0<b<1 = fraction; decay, always decreasing.
B is never negative only the multiplier is.
h = lf/rt; opposite
k = up/dn


Linear Programming
 |
||||||||
Vertices:
|
||||||||
Constraints
|
Objective Function: C=4x + 6y
|
|||||||
x > 0
y > 0
x + y < 6
|
||||||||
 |
||||||||
Vertices:
|
||||||||
Constraints
|
Objective Function: C= 8x + 7y
|
|||||||
x < 5
y > 4
-2x + 5y < 30
|
||||||||
 |
||||||||
Vertices:
|
||||||||
Constraints
|
Objective Function: C= 7x + 3y
|
|||||||
x > 1
y > 2
6x + 4y < 38
|
||||||||

<<<Image Goes Here>>>
|
||||||||
|
Vertices:
|
|
|
|
|
||||
|
Constraints
|
Objective Function: C= 4r + 6y
|
|||||||
| x>0 y<8 -2r+3y>12 |
|
|
|
|
||||
 |
||||||||
|
Vertices:
|
|
|
|
|
||||
|
Constraints
|
Objective Function: C=8x+7y
|
|||||||
|
x>0
y>0
4x+4y<20
x+2y<8
|
|
|
|
|
|
|||
 |
||||||||
|
Vertices:
|
|
|
|
|
||||
|
Constraints
|
Objective Function: C=3x+5y
|
|||||||
|
x>0
2x+3y>6
3x-y<9
x+4y<16
|
|
|
|
|
|
|||
Monday, March 10, 2014
Thursday, February 27, 2014

Tuesday, February 25, 2014
Tuesday, January 28, 2014
Arithmetic And Geometric Sequence
Arithmetic & Geometric Sequences
A sequence is a list of numbers.
General Form of an Arithmetic Sequence
an = a1 +(n - 1)d
General Form of an Geometric Sequence
an = a1·rn-1
An arithmetic sequence represents a linear function.
Arithmetic Sequence
This video introduces arithmetic sequences.
www.youtube.com/watch?v=jExpsJTu9o8
Geometric Sequence
This video introduces geometric sequences.
Tuesday, January 14, 2014
Characteristics and Traits
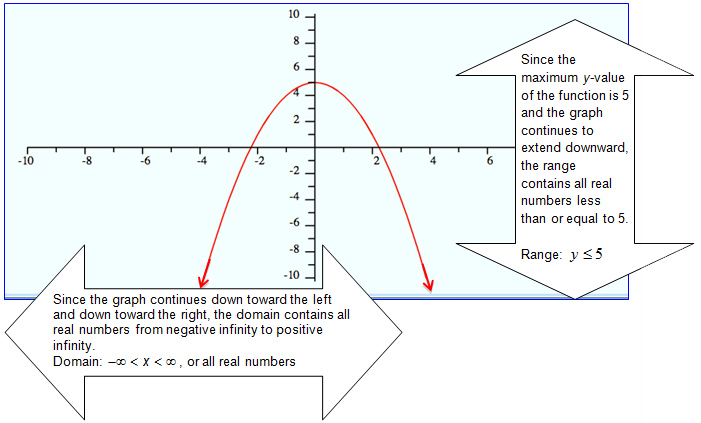
Domain- X Values - How far left or right the graph goes.
Range- Y Values- How far up or down the graph goes.
End Behavior- Describing the two ends of the equation
Absolute Max/Min- 1 point that is highest or lowest on a graph. (x,y)
Local Max/Min- More than 1 point that is highest or lowest on the graph.
Interval of Increase- Intercept point of rising x and y values
Interval of Decrease- Intercept points of falling x and y values.
Symmetry- Even is symmetric across the x axis, odd is symmetric across the origin, neither has no symmetry.
X intercept- Intercept point of the x-value
Y intercept- Intercept point of the y-value
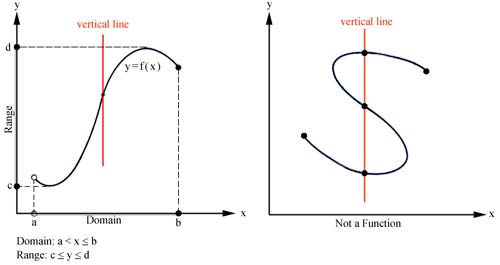
Function- Passes the vertical line test.
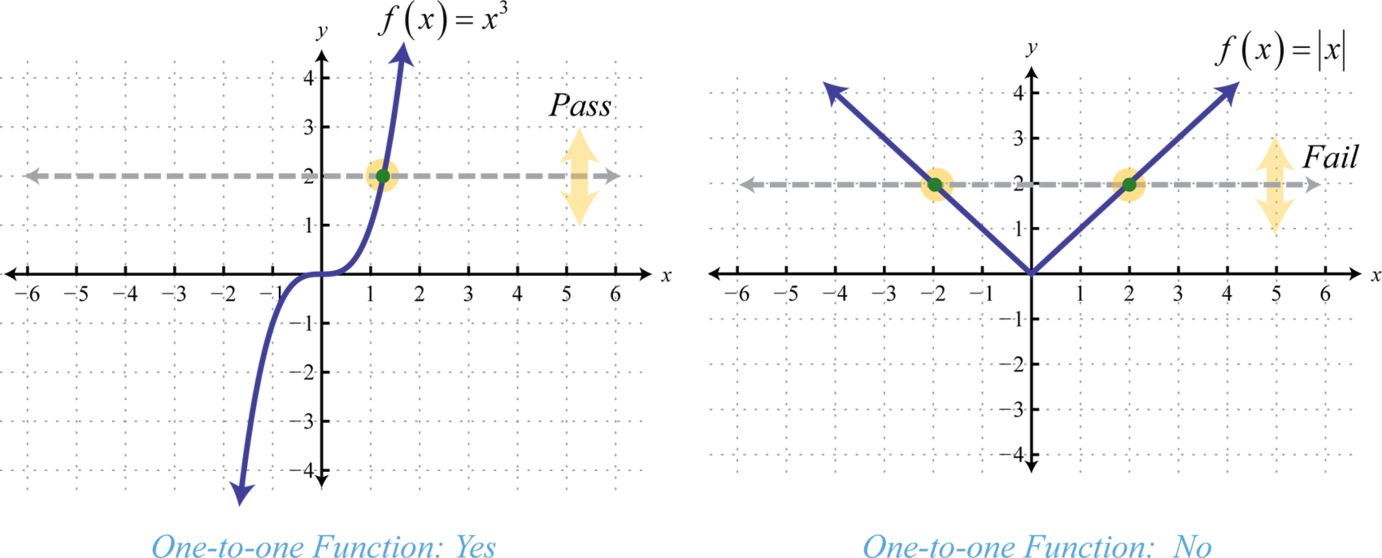
One to One- Passes both vertical and horizontal line test.


Range- Y Values- How far up or down the graph goes.
End Behavior- Describing the two ends of the equation
Absolute Max/Min- 1 point that is highest or lowest on a graph. (x,y)
Local Max/Min- More than 1 point that is highest or lowest on the graph.
Interval of Increase- Intercept point of rising x and y values
Interval of Decrease- Intercept points of falling x and y values.
Symmetry- Even is symmetric across the x axis, odd is symmetric across the origin, neither has no symmetry.
X intercept- Intercept point of the x-value
Y intercept- Intercept point of the y-value
Function- Passes the vertical line test.
One to One- Passes both vertical and horizontal line test.
 |
| Domain & Range |
End Behavior
Absolute Max/Min
Local Max/Min
X & Y Intercept
Symmetry
Function- Vertical Line Test
One to One- Horizontal Line Test
Subscribe to:
Comments (Atom)